
Modern ecommerce teams need more than raw reports; they need a reliable way to turn product, customer, and trading data into decisions. Ocula.tech can be understood as a platform focused on product intelligence, analytics visibility, and practical business insight for digital commerce operations. Its value lies in helping teams identify what is performing, what is underperforming, and where commercial improvements can be made with greater confidence.
TLDR: Ocula.tech brings together product data, analytics dashboards, and business intelligence capabilities to help ecommerce teams improve decision-making. For example, a merchandising team could identify that 18% of high-traffic products have weak content, refresh those pages, and then monitor whether conversion improves by 5% over the next month. The platform is most useful when teams need clearer visibility across product performance, content quality, customer behavior, and revenue opportunities. It supports faster prioritization by turning scattered data into structured, actionable insights.
Product Features and Platform Purpose
At its core, Ocula.tech is designed to support teams that manage large product catalogs, complex ecommerce journeys, and performance targets across multiple departments. In a traditional setup, product managers, merchandisers, marketing teams, and analysts often work from separate spreadsheets, ecommerce tools, and analytics platforms. This creates delays, conflicting interpretations, and missed opportunities.
Ocula.tech addresses this problem by giving businesses a more organized view of product and commercial performance. The platform can help teams assess product listings, understand content gaps, evaluate category performance, and connect product-level issues to measurable business outcomes. Instead of looking only at sales totals, users can investigate the conditions behind sales performance, such as visibility, product information quality, customer engagement, and conversion behavior.
Important product features typically include:
- Product performance tracking: Visibility into revenue, conversion, views, availability, and category-level trends.
- Content quality analysis: Identification of missing, weak, inconsistent, or poorly optimized product information.
- Catalog intelligence: A structured view of product data across categories, brands, attributes, and variants.
- Workflow prioritization: Tools that help teams decide which product pages, categories, or issues should be addressed first.
- Business intelligence reporting: Dashboards that translate product and trading data into clear operational insight.
For ecommerce organizations, the advantage is not simply having more data. The advantage is having data presented in a way that supports decisions. A senior manager may want to see category revenue and margin trends, while a product content team may need a list of high-value pages with missing specifications. A strong platform should support both needs.
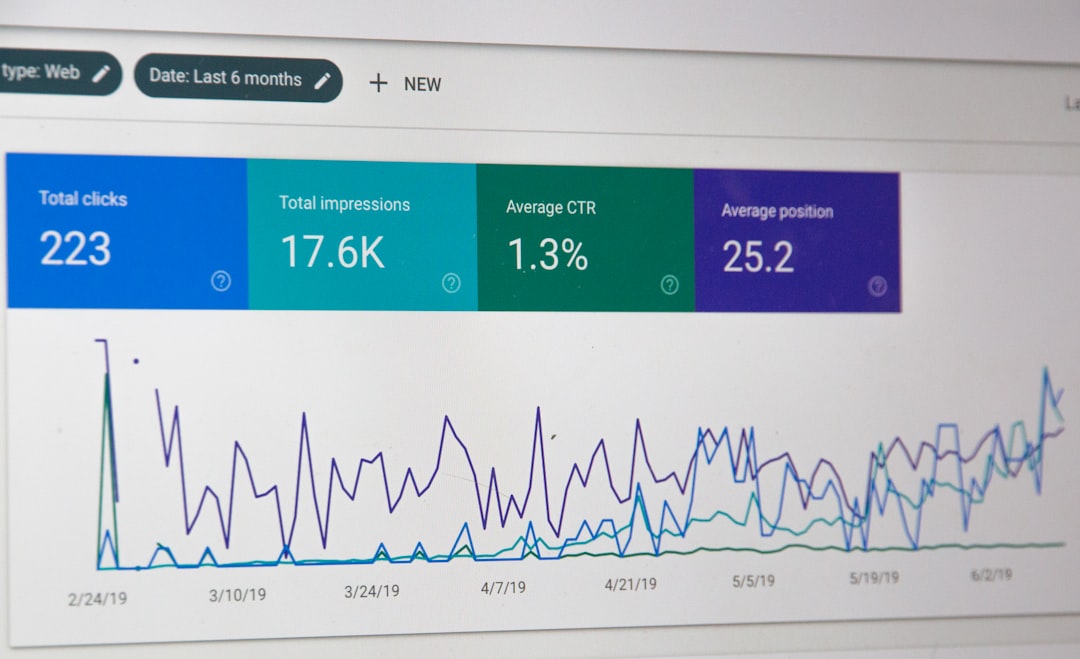
Analytics Dashboards: From Visibility to Action
The analytics dashboard layer is one of the most important parts of Ocula.tech. Dashboards help users move from static reporting to active monitoring. Rather than waiting for end-of-month performance reviews, teams can inspect trends, detect anomalies, and act while there is still time to influence results.
A well-structured dashboard should provide a reliable view of both business outcomes and operational drivers. Business outcomes include revenue, conversion rate, average order value, product sales, and category growth. Operational drivers may include product availability, content completeness, traffic quality, search visibility, customer engagement, and merchandising effectiveness.
Typical dashboard views may include:
- Executive overview: High-level trading metrics, growth trends, and performance summaries for leadership teams.
- Category performance: Insight into which categories are growing, declining, or underperforming against benchmarks.
- Product diagnostics: Product-level analysis showing traffic, conversion, content gaps, and revenue contribution.
- Content improvement dashboard: A prioritized view of listings that need better descriptions, imagery, specifications, or attributes.
- Opportunity reporting: Identification of products with high traffic but low conversion, suggesting a need for optimization.
The strongest dashboards are not overloaded with every available metric. They focus attention on what matters. For example, a product with 12,000 monthly views but a 0.6% conversion rate may deserve more immediate attention than a product with only 200 views and no sales. By highlighting these differences, Ocula.tech can help teams allocate resources more effectively.
Key Capabilities for Ecommerce Teams
Ocula.tech’s key capabilities are best understood through the operational problems it helps solve. Ecommerce teams frequently face questions such as: Which products are losing sales due to weak content? Which categories need investment? Which items should be promoted, improved, or removed? Which issues are most likely to affect revenue?
Product data intelligence is one of the most valuable capabilities. Product catalogs often contain inconsistencies, incomplete attributes, duplicate information, or descriptions that do not support customer decision-making. By surfacing these issues, the platform helps businesses improve the quality and commercial usefulness of their product pages.
Performance monitoring is another essential capability. Teams can review how products and categories behave over time, rather than relying on isolated snapshots. This is particularly important during seasonal campaigns, pricing changes, product launches, and stock fluctuations.
Prioritization is also critical. Not every product page can be improved at once, and not every issue has the same financial impact. The ability to rank opportunities by traffic, revenue potential, conversion gap, or content weakness helps teams focus on actions that are more likely to produce measurable results.
Cross-functional alignment is a further benefit. Merchandising, ecommerce, marketing, and leadership teams often interpret performance through different lenses. A shared analytics environment creates a common source of evidence, reducing debate and improving accountability.

Business Intelligence Overview
Business intelligence in Ocula.tech is about connecting data to business questions. A conventional analytics tool may show that conversion has declined. A more useful intelligence layer helps investigate why it declined and what can be done next. This shift from reporting to diagnosis is where ecommerce teams gain practical value.
For example, a retailer may notice that a category has strong traffic but declining revenue. A business intelligence dashboard could show that 30% of top-viewed products in that category have incomplete specifications, several bestsellers are out of stock, and competitor pricing pressure has increased. With this information, the team can separate content issues from availability issues and respond with a more targeted plan.
Useful business intelligence features may include:
- Trend analysis: Monitoring performance changes across weeks, months, campaigns, and seasons.
- Benchmarking: Comparing products, categories, or brands against historical averages or internal targets.
- Segmentation: Breaking down performance by product type, customer behavior, traffic source, or category.
- Exception reporting: Highlighting unusual drops, spikes, or quality problems that require investigation.
- Actionable recommendations: Translating detected issues into practical next steps for teams.
This approach supports a more disciplined operating model. Instead of relying only on intuition, teams can use evidence to decide where to invest time, which product pages need attention, and what commercial risks should be escalated.
Practical Use Case Scenario
Consider an online retailer with 25,000 active products across fashion, home, and lifestyle categories. The company sees stable traffic but limited revenue growth. Using Ocula.tech, the ecommerce team identifies that 4,200 products have incomplete attribute data, 1,100 high-traffic products have short or generic descriptions, and 8% of products generating significant search visits have below-average conversion rates.
The team prioritizes the top 300 products by revenue opportunity. Product content is improved, missing attributes are added, and dashboard monitoring is set up for conversion rate, add-to-cart rate, and revenue per visit. After six weeks, the team can compare performance against the previous period and assess whether the improvements justify wider rollout. This kind of structured testing makes optimization more measurable and less speculative.

Why It Matters
Ocula.tech is most valuable for organizations that want to make product and ecommerce decisions with greater structure. Its features are not just about displaying numbers; they are about helping teams understand relationships between product data, customer behavior, and commercial performance.
In competitive digital markets, small improvements can have meaningful financial impact. Better content can reduce uncertainty for shoppers. Better dashboards can shorten the time between problem detection and action. Better intelligence can help teams focus on opportunities that matter most.
For businesses managing complex ecommerce operations, Ocula.tech offers a serious framework for product analytics, dashboard reporting, and business intelligence. When implemented with clear objectives and clean data, it can support more informed decisions, stronger internal alignment, and a more disciplined approach to growth.
Leave a Reply