Choose Brandwatch if your Share of Voice calculation depends on social, news, forums, podcasts, and consumer conversation; choose Semrush if your SOV is mainly about search visibility. Both can support serious SOV reporting, but they measure different types of attention. Treating them as interchangeable is where many reports go wrong.
TLDR: Brandwatch is better for measuring conversation-based Share of Voice, while Semrush is stronger for search-based Share of Voice. For example, a skincare brand may find that it owns 18% of social mentions in Brandwatch but only 7% of organic search visibility in Semrush. That gap tells a useful story: people are talking about the brand, but competitors still win more search demand. Use both if leadership needs a fuller view of brand visibility.
What an SOV calculator should actually measure
Share of Voice, or SOV, measures how much visible attention your brand gets compared with competitors. The simple formula is:
Your brand visibility ÷ total category visibility × 100 = Share of Voice
The hard part is deciding what “visibility” means. In Brandwatch, it usually means mentions, engagement, sentiment, authors, reach, or media coverage. In Semrush, it usually means keyword rankings, search volume, estimated traffic, position changes, and paid search presence.
That difference matters. A brand can dominate TikTok chatter and still be nearly invisible on Google. Another brand can win high-value keywords while receiving little public conversation. Both are real. They just answer different questions.

Brandwatch as an SOV calculator
Brandwatch is best when your SOV question is about public conversation. It collects data from social networks, blogs, forums, review sites, news sources, and other public web sources. Teams use it to understand who is being discussed, where the discussion happens, and whether sentiment is improving or fading.
A typical Brandwatch SOV setup compares mention volume across a defined group of brands. For example:
- Your brand: 12,400 mentions
- Competitor A: 21,700 mentions
- Competitor B: 9,900 mentions
- Competitor C: 6,000 mentions
Total category mentions are 50,000. Your SOV is 24.8%. That is simple on paper. In real use, the quality of the query decides whether the result is credible.
Brandwatch is strong because it lets analysts clean the data. You can exclude spam, remove irrelevant meanings, separate product names, track campaign hashtags, and segment results by country or channel. That is vital for brands with common names. Honestly, it feels like skipping query cleanup is the fastest way to produce a beautiful chart that is completely wrong.
Brandwatch also helps when SOV is tied to reputation. You can break SOV into positive, neutral, and negative mentions. If your brand has 30% total SOV but half of that attention is negative, the number needs context. High visibility is not always good news.
Where Brandwatch falls short
Brandwatch is not a search visibility tool. It can show conversation around search topics, but it will not give the same keyword-level view as Semrush. It also needs careful setup. Boolean queries can get messy, especially in crowded categories.
Expect to waste time on exclusions at the start. A brand name that also means a place, person, movie, or common phrase can pollute the results. Once fixed, the reporting can be very strong. Before that, SOV percentages may swing for reasons that have nothing to do with the market.
Semrush as an SOV calculator
Semrush is best when your SOV question is about Google visibility. It helps calculate how much of the search opportunity your website captures compared with competitors. This is especially useful for SEO teams, paid search teams, content marketers, and e-commerce brands.
In Semrush, SOV often uses a keyword set. You choose tracked keywords, locations, devices, and competitors. The tool then estimates visibility using rank positions, search volume, and sometimes click-through assumptions.
For example, a finance software company may track 500 commercial keywords. Across those terms, the estimated search opportunity is 240,000 monthly searches. If the company earns visibility equal to 36,000 estimated visits, its search SOV is roughly 15%. If the top competitor captures 62,000 estimated visits, that competitor has about 25.8%.
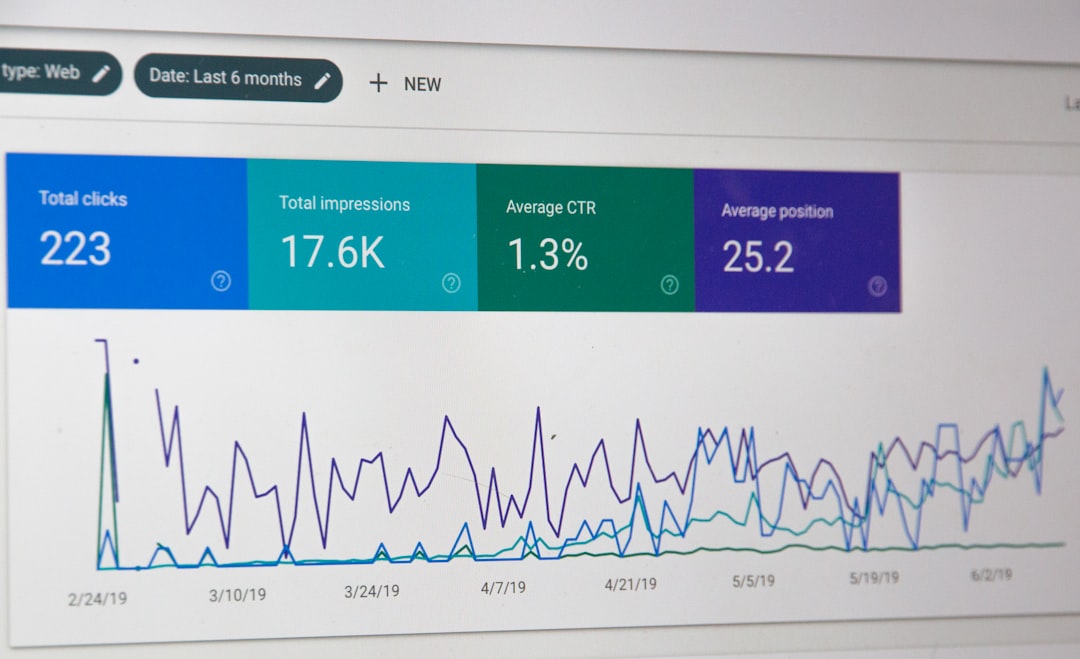
The main strength is granularity. Semrush can show which keywords caused the SOV change. If your share drops from 15% to 11%, you can inspect ranking losses, newly ranking competitors, SERP features, and paid ads. That makes the data more actionable for search teams.
Where Semrush falls short
Semrush does not capture broad brand conversation. It can show branded search demand and website visibility, but it will not fully explain what people are saying on Reddit, X, Instagram, TikTok, news sites, or review platforms.
The catch is that Semrush SOV depends heavily on the keyword set. If you track only branded keywords, your score may look strong. If you add broader category terms, your score may fall sharply. Neither number is “wrong,” but the second one often reflects the competitive reality better.
Another issue is that estimated traffic is still an estimate. Search volume, click-through rates, and SERP behavior are not perfect. For board reporting, that is acceptable if the method stays consistent. For precise revenue reporting, connect the analysis with analytics and CRM data.
Brandwatch vs Semrush: which SOV calculator is more accurate?
The more accurate tool is the one aligned with the question. Brandwatch is more accurate for conversation share. Semrush is more accurate for search visibility share. Accuracy drops when either tool is forced outside its core use.
| Use case | Better option | Reason |
|---|---|---|
| Social media SOV | Brandwatch | Tracks public conversation and engagement patterns. |
| SEO visibility SOV | Semrush | Tracks rankings, keywords, and estimated search traffic. |
| PR campaign impact | Brandwatch | Measures mentions, media coverage, and sentiment. |
| Content gap analysis | Semrush | Shows keyword opportunities and competitor rankings. |
| Executive brand report | Both | Combines conversation and search visibility. |
A practical user case
Consider a mid-market coffee brand competing against three national brands. The marketing team runs a spring campaign for cold brew. They want to know if the campaign increased market attention.
In Brandwatch, the brand’s conversation SOV rises from 9% to 16% over six weeks. Positive sentiment improves from 54% to 68%. Most growth comes from Instagram comments, creator posts, and a few food blogs.
In Semrush, the same brand’s search SOV rises only from 4.5% to 5.2% across cold brew keywords. The campaign created buzz, but organic rankings barely moved. That is a useful finding. The team should keep the creative idea but invest in landing pages, product content, and links if search growth is the next goal.

How to build a reliable SOV calculation
For Brandwatch, define the query with care. Include brand names, product names, campaign terms, and common spelling variants. Exclude irrelevant uses. Segment by market if the brand operates in multiple countries.
For Semrush, build a fixed keyword set. Separate branded, non-branded, commercial, and informational keywords. Track desktop and mobile if both matter. Keep competitor lists stable unless there is a clear reason to change them.
Use these rules for cleaner reporting:
- Never mix channels without labeling them. Social SOV and search SOV are not the same metric.
- Report trend data, not just one snapshot. A single month can be distorted by news, seasonality, or one viral post.
- Add context to every percentage. A 20% share with negative sentiment is not a clean win.
- Keep methods consistent. Changing queries or keyword sets can break comparisons.
Final recommendation
If you need one SOV calculator for brand, PR, social, and reputation work, choose Brandwatch. If you need one for SEO, content, and paid search visibility, choose Semrush. If budget allows, use both and report them as separate but connected indicators.
The serious approach is not to ask which tool has the “true” SOV number. Ask which part of attention you are measuring. Brandwatch tells you how much people are talking about you. Semrush tells you how often searchers can find you. Together, they give a clearer view of brand strength.
Leave a Reply